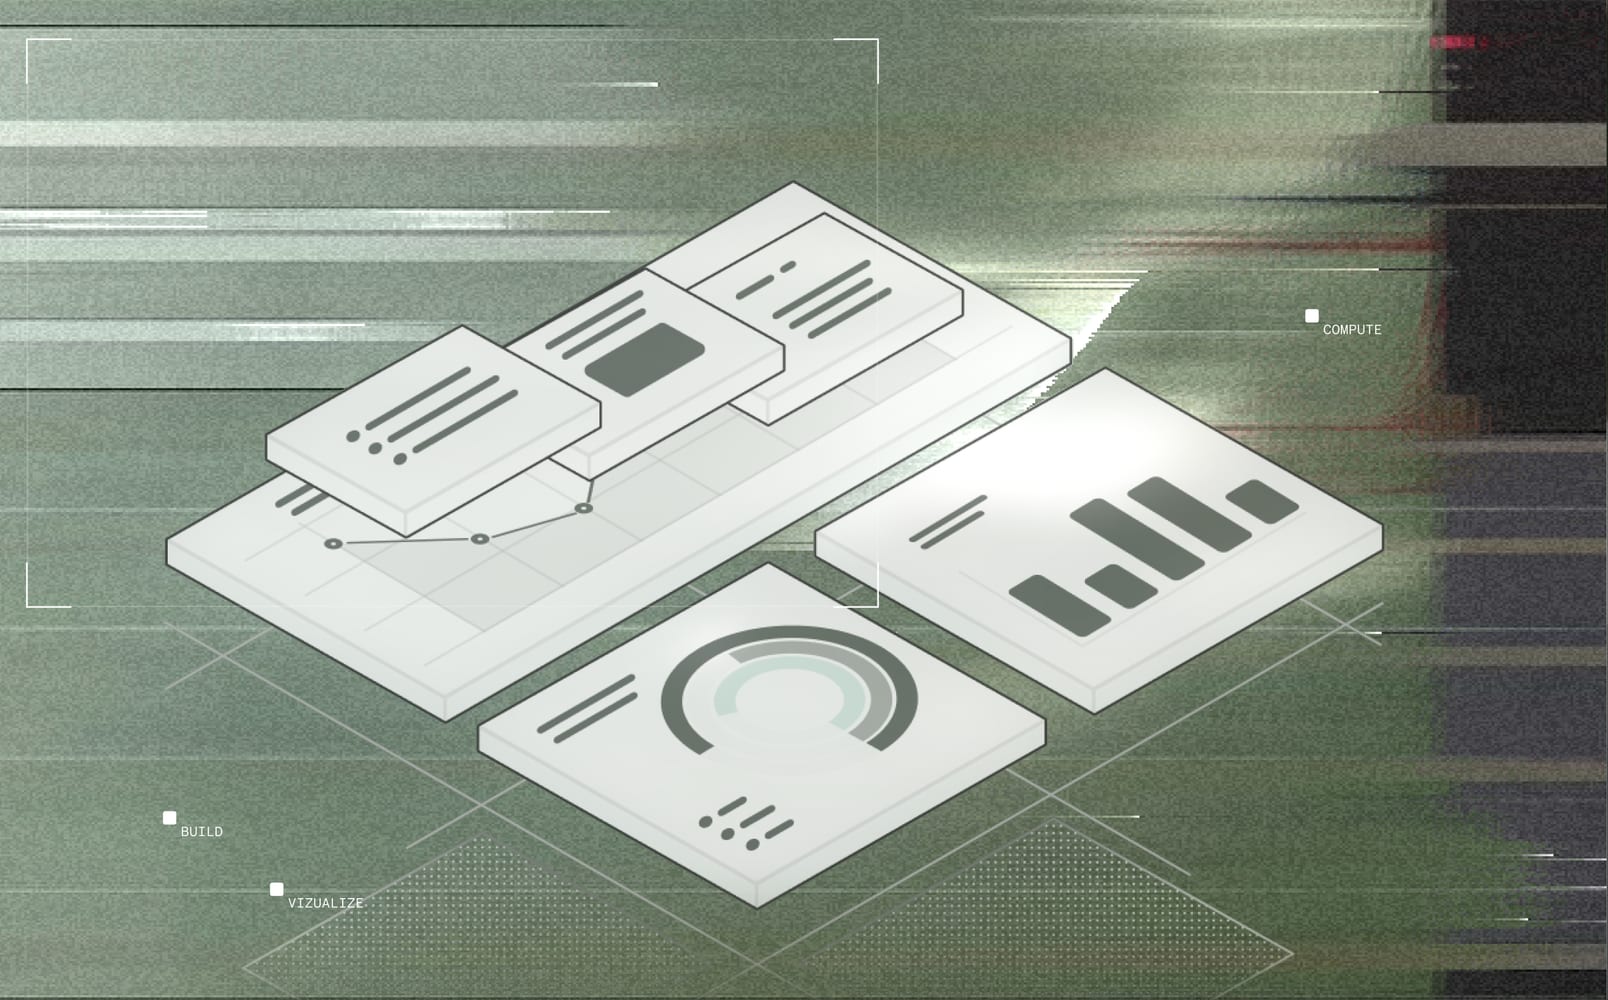
Today, we're announcing Data Apps in TextQL.
Data Apps are the evolution of Dashboards in Ana. Dashboards already gave you a self-service view of your data, built fast and accurate because the logic lives in the ontology instead of raw queries. Data Apps extend that foundation from a static view into a fully interactive application. They trigger workflows, collect and write data, and get shared and governed like any other production system.
Dashboards haven't gone away. They're now one type of Data App.
Built for an open stack
Under the hood, Data Apps are written in React and JavaScript.
This is a deliberate choice. Traditional analytics tools render into proprietary formats that only one tool can open, such as a .twbx that requires Tableau or a .pbix that requires Power BI.
If you've ever been through a BI migration, you know the pain. Dashboards, semantic models, calculated fields: all locked in a format that requires a specific vendor's license to open, edit, or move.
A Data App is a standard web application. It runs anywhere a browser does and can be inspected, extended, and maintained using ordinary web development tooling.
Anatomy of a Data App
Data App
one published bundle - powered by 4 components
App Tree
the files that render the UI
- index.htmlentry document (the 'code' field)
- .js / .mjsReact ES modules, no JSX/TS
- .cssstylesheets
- .svg / imageslogos, icons, illustrations
- .json / .txt / .mdstatic config, copy, small data
Data Sources
how data enters the app
- sql_queryraw SQL against a connector
- ontology_sqlontology metrics query (JSON)
- fileuploaded CSV / xlsx
- library_tqla .tql file from the library
- python_codePython to a pandas DataFrame
Compute Functions
server-side, run at view time
-
functions/
.py Python, real branching logic -
functions/
.tql inline TQL, single statement - tql_pathreuse a library .tql file
App Database
the app's own private DuckDB
- app_db_setup.sqlDDL / setup SQL statements
Data Apps live in the ontology alongside the data, definitions, and workflows they depend on. That makes each application discoverable, traceable, and reusable across the platform. People and agents can see what a given app uses, how it connects to the business, and extend it without reconstructing its context from scratch. Because the ontology is a Git-backed file tree, apps are versioned, syncable, and portable across environments using standard development workflows.
That changes the starting point for application development. Low-code and no-code tools have made it faster to go from idea to working app, but most still begin with a blank canvas. Data Apps begin with the company's business logic already modeled and governed.
The result is an application that is fast to build and correct by construction.
Enterprise-ready by construction
Two properties separate Data Apps from a prototyping tool:
- Version control. Every Data App is a tracked, versioned artifact, consistent with how the rest of the platform manages change.
- Row- and user-level access control. Published apps can be shared with individual users or groups. Access to the underlying data follows the same permissions model, so each person sees only what they are allowed to access.
The resulting artifact is auditable and access-controlled from the start.
What Data Apps are used for
Data Apps are built for a broader set of jobs than reporting alone:
- Triggering workflows. Initiating a process from within the app rather than only displaying its output.
- Data collection. Accepting structured input, including file uploads and forms, directly through the app.
- Writing back to the warehouse. Updating underlying data and validating the result in the same interface used to view it.
- Data storytelling. Walking through a finding or trend narratively rather than presenting a collection of charts.
A Data App can be a report, a workflow, a command center, or a complete internal tool.
Every Data App has a backend
Data collection and warehouse writebacks are possible because each Data App has its own persistent database, powered by DuckDB. It stores what the app collects and keeps it across sessions. An app can take a submission, hold a queue, or save a result, and that data is there the next time someone opens it. This is what makes a Data App something you operate, not just something you read.
It runs embedded in the app, so there is nothing to provision or maintain. It speaks standard SQL, and every write is versioned, consistent with how the rest of the platform tracks change.
Where the data goes next
Because the data is stored as SQL, it doesn't have to stay inside the app. It can move wherever it's useful.
It can be integrated out to a target warehouse. The app curates and validates the data locally, then writes only the finished result on a schedule, so the warehouse receives clean output rather than raw input.
It can also come back into TextQL as a connector. The app's database becomes a source the ontology models, so data captured in one app turns into governed, reusable data for the whole platform.
Either way, data that starts inside an app ends up governed like everything else on the platform, and available to any system that needs it.
Examples
Data Apps are open-ended by design. The range of what you can build is easier to show than to explain. Here are a few examples of what we and our beta customers have already built. All data shown has been scrubbed and replaced with synthetic values.
Data Reconciliation App
The Leasing Intake App shown below lets users upload a file, compare it against live warehouse data, and surface anomalies in a single workflow.
An agent handles the straightforward matches automatically. Any case that falls below a defined confidence threshold is routed to the user for review. Data can be written back to the warehouse or used to trigger further actions.
For middle-office teams, this creates a governed alternative to the Excel-based reconciliation workflows that still underpin many critical processes.
Data Stories
Data Stories turn live data into a narrative that teams can walk through with stakeholders.
The output is a polished, living artifact that refreshes as the underlying metrics change. New insights can be added as they emerge, without rebuilding a slide deck from scratch.
In this example, the Data Story presents a quarterly breakdown of the sales pipeline.
Monthly Company Health Memo
Data Stories can become full operating memos.
This example uses a fictional company called Averly to present a monthly health-of-the-business report. It brings together financial and customer metrics, top-performing products, and the highest-priority recommendations for the month ahead.
For one of our customers, a version of this report is distributed every month. A process that once required pulling metrics from several dashboards and manually assembling them into a memo now runs as a living artifact that updates with the business.
Art of the Possible
Not every Data App is a business report.
At TextQL, we built an interactive flight tracker that maps where our team is traveling, whether each trip is personal or customer-related, and where customer density is highest. It gives us a live view of where we spend time and where we go to meet customers.
We rebuilt our CRM as a Data App too. Members of our go-to-market team have built personal command centers that bring together pipeline management, agent activity, recent actions, and everything else they rely on to manage their day-to-day.
Build anything on one foundation
The examples above span different formats, use cases, and teams: data stories and operating memos, reconciliation workflows, internal command centers. What connects them is the TextQL ontology underneath.
That shared foundation expands who can build without giving up control. With the business logic, context, and governance already in place, teams can move from idea to working artifact in hours rather than waiting on an analytics or engineering cycle.
Dashboards were the first form this idea took. What comes next is up to what you build.
Getting started: In Ana, click New Thread, then use the "+" menu to select your data warehouse connector and set the output to Data App. Type your prompt and send it. Ana builds the app from there.