No manual chart building. No wrestling with BI tools. No additional licensing fees. Just conversation to production dashboard in minutes — all baked right into the TextQL you already have.
What We Built
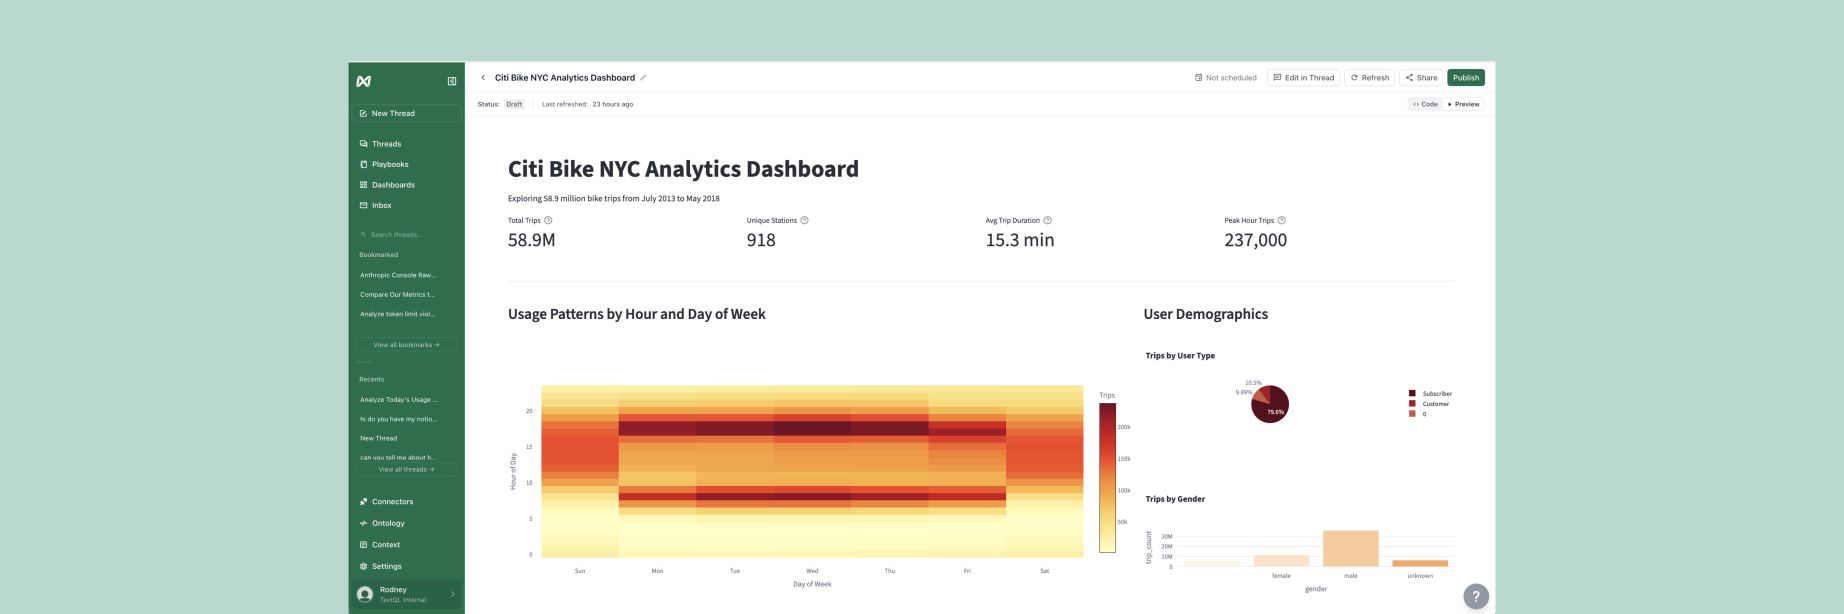
We've added a new Dashboards output format to TextQL. Now, when you ask Ana for charts, tables, or analysis, she can turn the result into a saved, interactive dashboard instead of a one-time response.
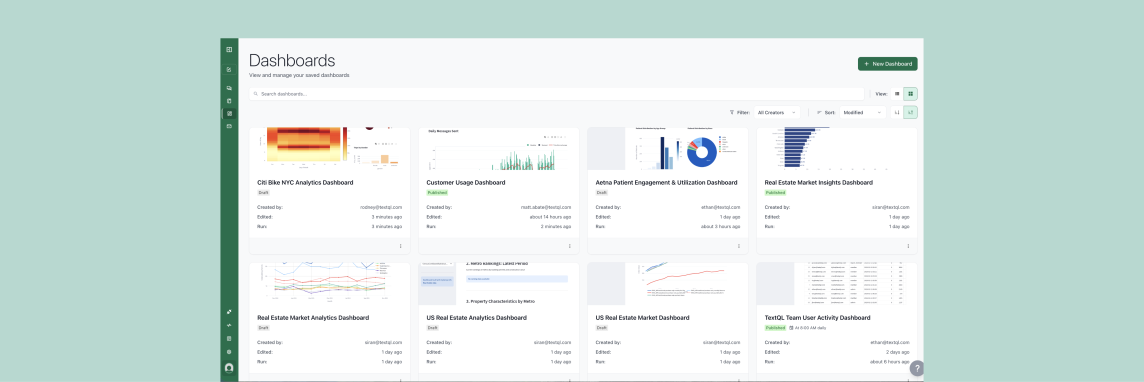
Dashboards run as Streamlit applications and support interactive filters, tooltips, and multiple tabs. You can manage them from the new Dashboards page — view your personal and team dashboards, keep drafts before publishing, configure update schedules, and export the supporting code when needed.
We built Persistent Dashboards to complement Playbooks. Playbooks regenerate new analysis from a prompt each time they run. Dashboards, by contrast, execute the same saved code reliably on every refresh — giving your team a stable, interactive application they can return to anytime.
Persistent Dashboards are available now in Public Preview to all TextQL customers.
Dashboards Should Be This Easy
Here's what we're seeing with early users:
An engineering team migrated all of their internal Power BI reports to Ana in one week. Why? As one engineer put it: "Nobody cares to invest in manually creating internal dashboards. It's a distraction."
One team had just migrated their marketing data to Snowflake. But their enormous legacy Power BI dashboard was still connected to the old warehouse. Thirty users kept using the old report because nobody wanted to rebuild it manually, so Ana rebuilt it for them in an afternoon. In their words: "Once Ana's given you a fantastic dashboard... who's gonna want to manually create an alternative?"
We've even seen executives create their own reports without waiting for the BI team.
This is what dashboards should have always been: describe what you want, Ana gets it working in minutes.
What You Can Build
Persistent Dashboards can turn any conversation into a live, scheduled, shareable application. Here's what teams are building:
Multi-Source Dashboards
Dashboards that pull from Snowflake, Salesforce, Amplitude, and your product analytics — all joined and visualized automatically.
Describe the metrics you care about: campaign performance by channel, customer segment breakdowns, month-over-month trends. Ana queries all the sources, joins the data, builds the visualizations, and schedules it to refresh daily.
Requirements to Dashboard — No Manual Work
One analyst described their workflow:
"I create the dataset I need and then I need to create all of the dashboards in the native editor. This is a manual process which is time consuming and daunting."
With TextQL Dashboards, those manual steps disappear.
Give Ana as much — or as little — direction as you want. A high-level request like "build an executive overview of pipeline and revenue" or detailed specifications covering metrics, filters, calculations, and layout.
Ana handles the chart creation, dashboard assembly, and configuration in a single session. What used to take hours or days of manual work is now done in minutes.
Dashboards from Any Inspiration
See a dashboard you like but don't have access to it? Found a concept in a slide deck or report?
Send Ana a screenshot, PDF, or even a sketch of what you want. She'll understand the layout, identify the visualizations, and build it connected to your data sources.
One user sent a screenshot of a complex Tableau dashboard they saw in a presentation. Ana rebuilt it in minutes — the same project used to take consultants weeks.
No need to have the original dashboard connected or be the owner. Just show Ana what you want, and she'll build it.
How This Fits with TextQL
You might be thinking: "Wait, doesn't TextQL already have Playbooks for scheduled reporting?"
Playbooks let you define a mission statement for Ana — a prompt that runs on schedule to produce reports delivered via email or Slack. Playbooks are perfect for narrative reports, alerts, and insights that change based on the data.
Persistent Dashboards are complementary: they're for interactive applications that your team explores, filters, and drills into. Where Playbooks deliver insights to you, Dashboards let you explore the data yourself.
Think of it this way:
- Playbooks: "Tell me every Monday what changed in our metrics and why"
- Dashboards: "Give me a live view of our metrics that I can filter and explore anytime"
Both are built through conversation with Ana. Both refresh on schedule. Both connect to all your data sources. You choose the format that fits your use case.
Security & Permissions
Dashboards inherit the security model of the Sandcastles they run in:
- Inherited Row-Level Security: If your Snowflake connector has RLS policies, they apply to dashboard queries automatically.
- RBAC Integration: Dashboards respect your organization's role-based access control. Only users with appropriate permissions can view or edit.
- Secure Deployment: Like Sandcastles, dashboards can run entirely within your VPC or on-prem data center. Data never leaves your perimeter.
Try It Today
Persistent Dashboards are available now to all TextQL customers in Public Preview.
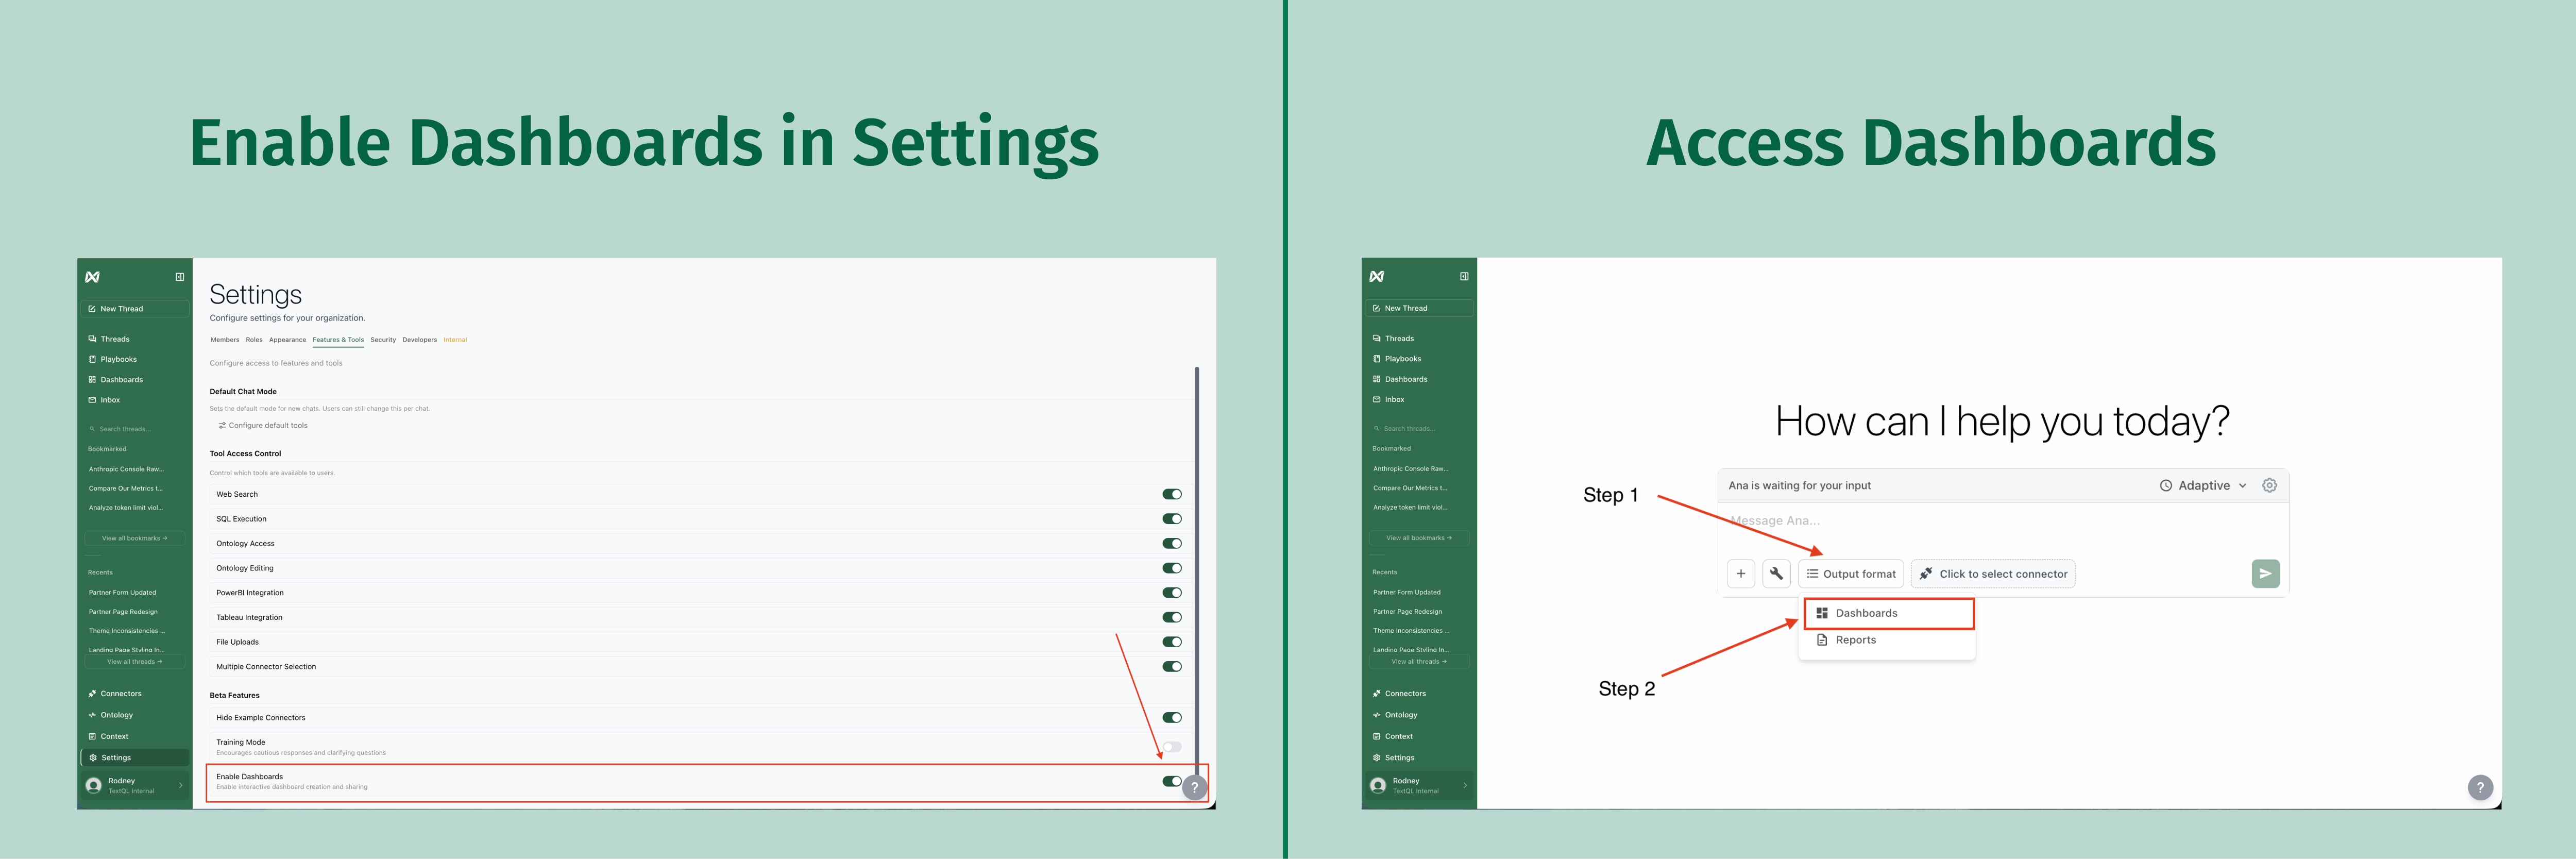
To enable dashboards in your workspace, go to Settings > Features & Tools > Enable Dashboards.
Then in any chat, select Output Format > Dashboards.
New to TextQL? Book a demo, reach out at support@textql.com, or try it today.