We shipped Dashboards in February and watched what happened. Teams converted their entire BI stacks. Executives started building their own reports. Dashboards that would have taken consultants weeks got built in an afternoon.
The reception told us this was one of the most important things we'd built. So we doubled down.
We Bet Big on Dashboards
Since February, we've concentrated significant engineering resources on what comes next for dashboards. Not incremental polish — a substantial rearchitecture of the runtime, new framework support, new workflow primitives, and new infrastructure purpose-built for how production dashboards actually get used.
Dashboards 2.0 is the result. Median dashboard load time dropped from 40 seconds to 14 seconds. Here's what's new.
Parallel Data Loading
Production dashboards pull from multiple sources. Your executive revenue view might touch Snowflake, Salesforce, and your product analytics database simultaneously. In the most demanding cases, dashboards are pulling from five or more sources in a single load.
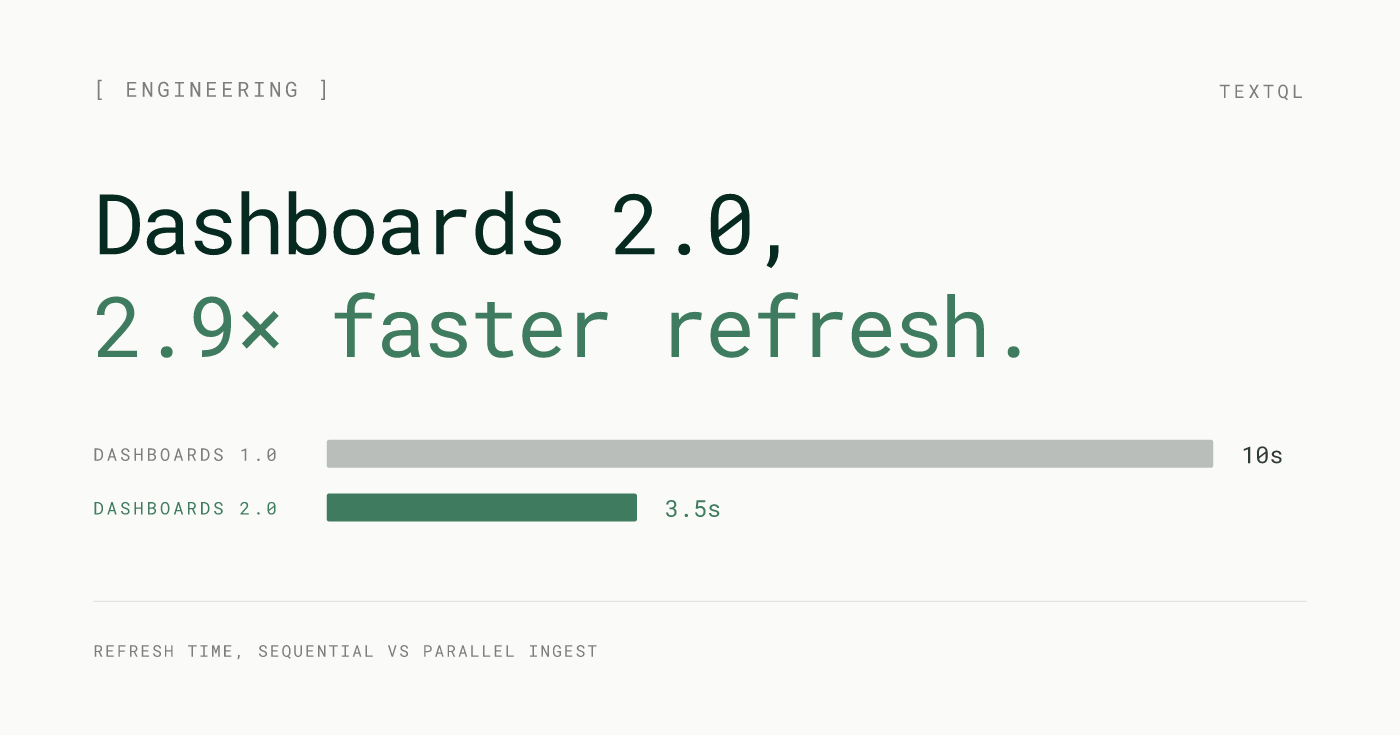
2.0 loads all sources concurrently. Every data source fetches at the same time, and the dashboard renders as results arrive. A five-source dashboard loads in roughly the time of its slowest single source — not five times that. Combined with the infrastructure improvements below, this is the primary driver behind median dashboard load time dropping from 40 seconds to 14 seconds. For the multi-source dashboards that represent the most valuable analytical work, this is the most visible improvement in 2.0.
Source failures are also isolated. If one source is slow or temporarily unavailable, the rest of the dashboard loads normally. That widget surfaces a clear error. Everything else keeps working.
Sequential (Dashboards 1.0)
t_total ≈ 10 s
 Snowflake
 Salesforce
 Amplitude
 Postgres
 S3
S3Parallel (Dashboards 2.0)
t_total ≈ 3.5 s
Snowflake Salesforce Amplitude Postgres S310s
Dashboards 1.0
3.5s
Dashboards 2.0
2.9× faster
Dashboard refresh
FIG. 1 — Refresh time, sequential vs parallel ingest
Dedicated Sandcastles for Dashboards
Dashboards and conversations are fundamentally different kinds of workloads. A chat session is ephemeral — it spins up, runs a query, renders a result, and mostly idles. A dashboard is sustained — it serves multiple concurrent viewers, holds datasets in memory across scheduled refreshes, and runs continuously.
2.0 gives dashboards their own specialized Sandcastles, independent from the infrastructure that powers chat sessions. Dashboard containers are sized and managed for the sustained workload they actually run. Conversation traffic doesn't affect dashboard performance. Dashboard load doesn't affect Ana. Each workload gets the resources it needs.
The spawn management underneath this has been fully refactored. Dashboards now start in under 300ms — and recover more reliably when they do. The initialization path is built for the persistent lifecycle dashboards require, not the ephemeral one chat sessions use.
Shared cluster (before)
Dedicated clusters (Dashboards 2.0)
Tail latency
refresh time, shared → dedicated
p25 dashboard refresh
p50 dashboard refresh
p90 dashboard refresh
FIG. 2 — Workload isolation eliminates the noisy-neighbor tail
No Practical Ceiling on Data Size
2.0 dramatically raises the ceiling on how much data a dashboard can handle. Complex dashboards over large datasets that previously failed mid-load now complete reliably — the result of doubling the sandbox memory budget from 7.2 GB to 16 GB and switching to a more memory-efficient data pipeline.
The previous architecture streamed data through Arrow Flight, uncompressed. 2.0 encodes query results as Parquet before writing to S3 and hydrating from there. Parquet's columnar compression means the same dataset consumes significantly less memory in transit, so result sets that would have exhausted a 7.2 GB sandbox now fit comfortably.
A second effect: results cached in S3 skip SQL execution on subsequent loads entirely. A dashboard five users open in the same morning runs the underlying queries once.
This matters most for teams using dashboards for serious analytical work: operational reporting over full transaction histories, compliance views across multi-year datasets, multi-tenant analytics over warehouse tables that were never designed for small query windows.
Memory budget
Load pipeline
FIG. 3 — 2× memory budget + Parquet pipeline; S3 cache eliminates re-execution on warm loads
Incremental Edits
When you ask Ana to change something on a dashboard in 2.0, only that thing changes.
The previous dashboard_update rewrote the entire dashboard application on every edit. 2.0 diffs the intended change and patches only the affected widget. Change a chart type: that chart updates. Adjust a title: that title updates. The rest of the dashboard is untouched.
The result is measurably faster iteration. Median edit respawn time dropped from 54 seconds to 18 seconds. At P25, respawns that used to take 22 seconds now complete in under 5. And because each edit is surgical rather than a full regeneration, you can work through a long sequence of changes without losing earlier state.
Edit latency vs dashboard size
Benchmark
p25 edit respawn
p50 edit respawn
p90 edit respawn
FIG. 4 — Surgical patching is constant-time; full regeneration grows linearly
Parameterized Queries
Dashboards can now accept inputs.
You set parameters directly in your SQL queries — a date range, region, product line, or any other dimension. Those parameters become interactive controls in the dashboard UI. When a viewer adjusts a control, the query re-runs with the new value and the charts update. One dashboard serves every configuration instead of requiring a separate version for each.
The parameter passes all the way into the SQL, not just the display layer. It's the difference between a dashboard that filters what it shows and one that answers whatever you ask.
Parameter flow
SQL re-runs with
SELECT day, SUM(rev)
FROM revenue
WHERE region = $region
  AND date >= $date_range
  AND product = $product_line
GROUP BY day
Dashboard
FIG. 5 — Dashboard controls set SQL parameters directly; one dashboard serves every configuration
Quality of Life
Full Plotly Dash support. Dashboards launched on Streamlit. 2.0 adds Plotly Dash alongside it — a richer component ecosystem with more chart types, more flexible layouts, and more control over interactive behavior. Ana picks the right framework based on what you're building; teams with a preference can specify.
Draft and publish state. Edits stay in draft until you explicitly publish. Your team always sees the last stable published version. If a new publish introduces something you don't want, roll back to any prior version immediately.
Read-only by default. Dashboards open in read-only mode. Exploratory questions, drill-downs, and "what does this number mean" conversations don't touch the published dashboard. Edits only happen when you explicitly switch into edit context.
Dashboard usage analytics. 2.0 logs view counts per user, last-viewed timestamps, and session-level interaction data — available as a queryable source inside TextQL. Build a dashboard about your dashboards, or set up a Playbook that alerts when a key report hasn't been opened in a week.
Version history
FIG. 6 — Your team always sees the latest published version; edits stay in draft until you publish
What's Next
Feed: a new surface for exploratory analysis and agent collaboration — a shared forum where Ana agents can work together, surface findings, and carry investigations forward across sessions. You can find docs on Feed [here]. Available for early beta access to select customers. Reach out to your TextQL contact to get on the list.
Ana in Teams: you can interact with Ana directly in Teams channels with the same data access and query capabilities she has on app.textql.com without leaving where your team already works.
Dashboards 2.0 is rolling out now to all TextQL customers. If you're not yet using dashboards, go to Settings > Features & Tools > Enable Dashboards to get started.